Nonlinear Models
These procedures are used to fit smoothed curves and surfaces to two-dimensional or multidimensional data.
The Spline Interpolation procedure fits smooth curves to X-Y data by linear, cubic, or tension spline interpolation. Displays plots and saves fitted values.
Polynomial Regression is used to fit a polynomial regression model of a dependent variable on one or more independent variables using polynomials up to degree nine. Results include coefficient table, stepwise AOV table, prediction, residuals, Durbin-Watson statistic, variance-covariance of regression coefficients, fitted curve, contour plot, surface coplot, residual plots, normal probability plot.
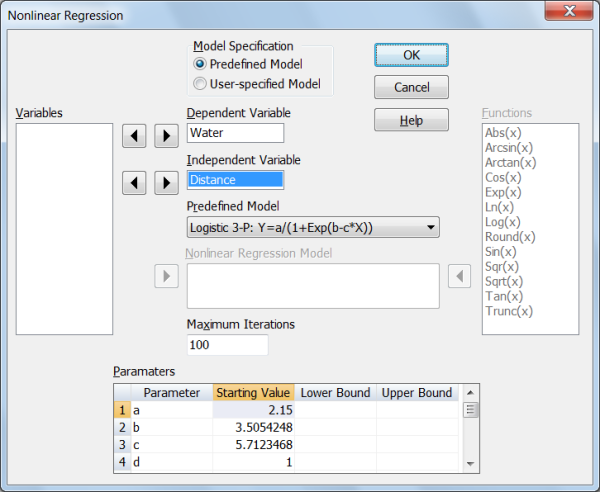
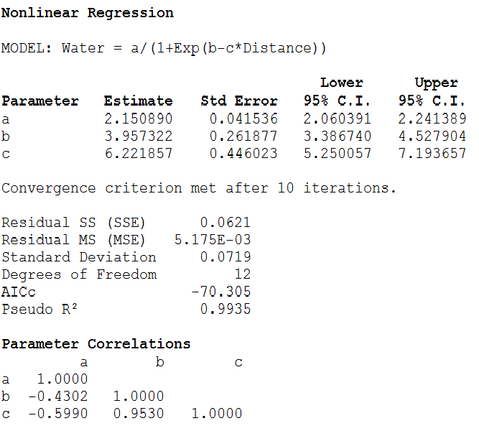
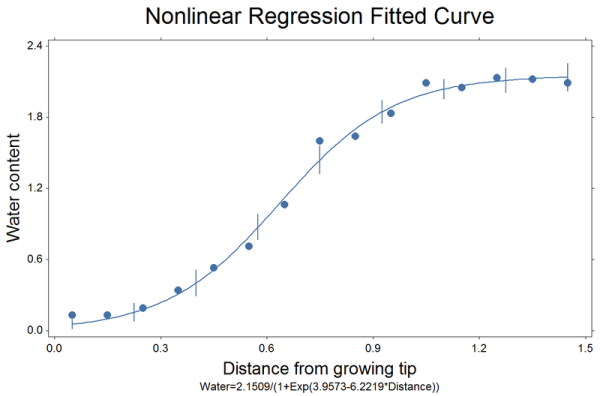
Nonlinear Regression uses the Levenberg-Marquardt-Nash algorithm to fit nonlinear regression models to data with one or more independent variables. Models may include up to 20 independent variables and 20 parameters. Choose from the list of 30 predefined models or create your own model. Results include coefficient estimates, confidence intervals, correlations, prediction, residuals, variance-covariance of regression coefficients, fitted curve, contour plot, surface coplot, residual plots, normal probability plot.
The Loess procedure fits smoothed curves and surfaces to multivariate scattered data using local linear regression with nearest neighbor bandwidth. Resulting models are evaluated using plots and residual analysis.
Example Reports and Plots