Linear Models
Statistix offers you a comprehensive selection of linear model procedures, which include regression, analysis of variance, and analysis of covariance. Linear models are among the most powerful and popular tools available for data analysis.
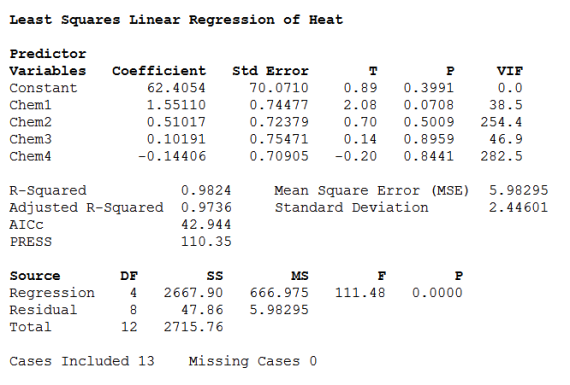
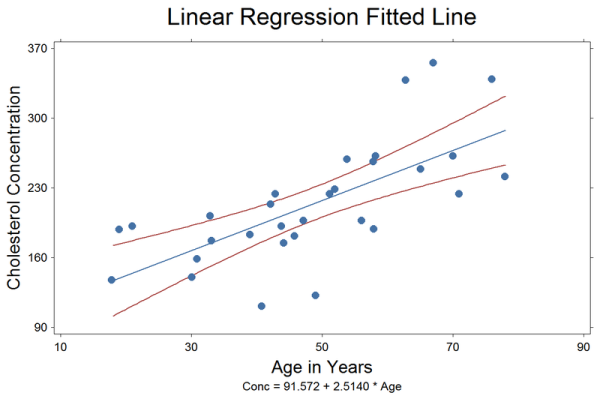
Linear Regression: Fit models with up to 100 independent variables. Results include coefficient table, ANOVA table, stepwise ANOVA table, Durbin-Watson Test, prediction, variance-covariance matrix of betas, fitted line plot, residuals plots, normal probability plot. Perform forward and backwards stepwise regression, best subsets regression, weighted regression.
Logistic Regression for the analysis of proportions. Optional stepwise procedure, Hosmer-Lemeshow Statistic, odd ratios, variance-covariance matrix of betas, save residuals.
Poisson Regression for the analysis of count data. Results include coefficient table, deviance test, variance-covariance matrix of betas, save residuals.
The Two Stage Least Squares Regression is used to estimate a linear equation when one or more of the predictor variables, or right hand side variables, is an endogenous variable. An endogenous variable is one that’s determined by the system of equations being solved.
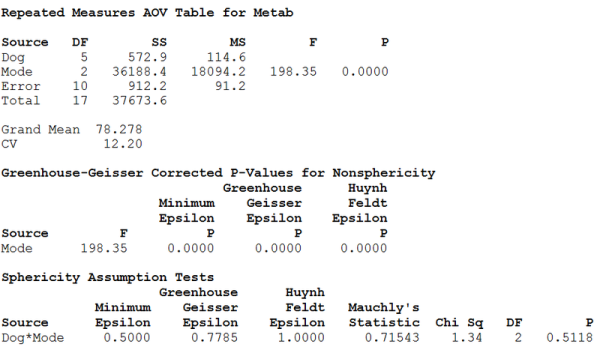
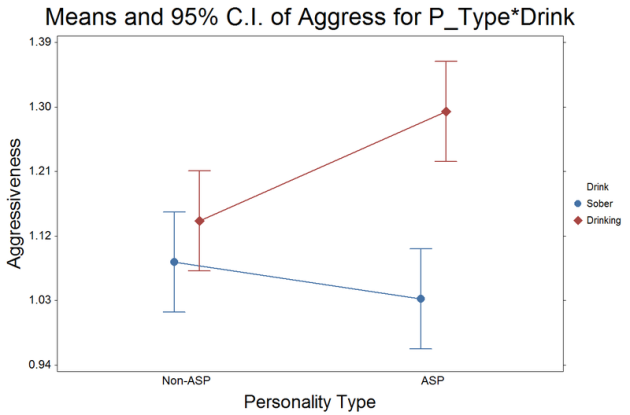
Analysis of Variance: Dialog boxes for one-way, Latin Square, completely randomized, complete block, Latin square, balanced lattice, full and fractional factorial, split-plot, strip-plot, split-split-plot, split-strip-plot, and repeated measures designs. Specify any model with the General ANOVA procedure. Analysis of covariance, least square means, unbalanced designs, multiple comparison of means, simple effects, contrasts, polynomial contrasts, residuals, means plot, residuals plots, normal probability plot.
Correlations: Compute a table of Pearson's correlations for up to 100 variables. Optionally display p-values, Cronbach's Alpha, Fleiss' Kappa.
Partial Correlations: Compute the correlations of a set of independent variables with a dependent variable after adjusting for the effects of another set of independent variables.
The Variance-Covariance procedure computes the variances and covariances for a list of up to 100 variables.
Eigenvalues and Eigenvectors
Principal Components
Example Reports and Plots